Loading...

Visual Chart

Unlock the value of data to deliver more convincing business insights

Free Trial Book a Demo

01

Interactive
Analysis

02

Cool Dynamic
Effects

03

Open User
Ecosystem

How Enterprises Visualize Data

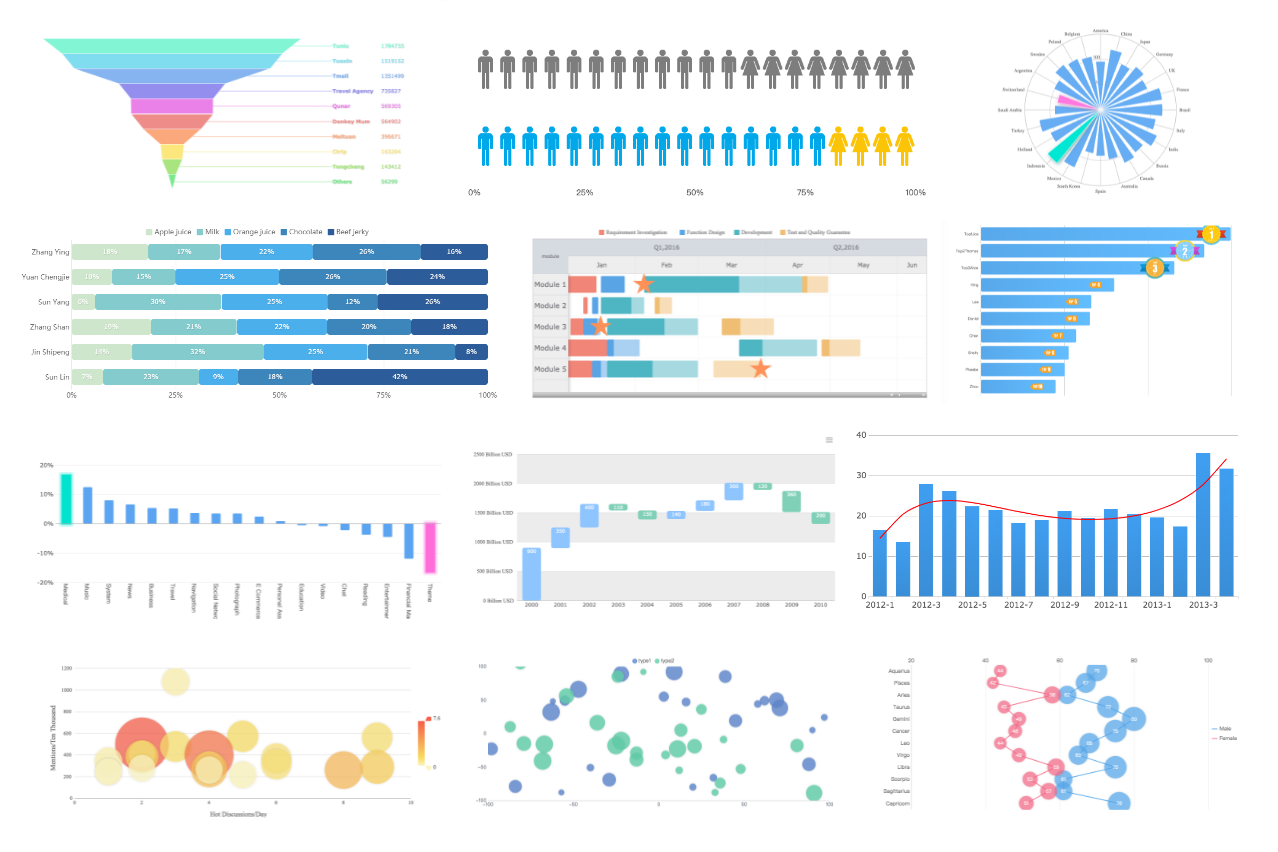
50+ in-house developed charts

Find the right solution to visualize your data

  • It includes mainstream chart types and provides a wealth of configuration options.
  • Some easy setups allow you to get effects like warning lines, highlights, and alternate row colors to demonstrate the value of data.

Allow interactive analysis

Gain business insights from data

  • Click on a partition of a chart, and other charts will change in sync. You can also drill down the chart for detailed data.
  • You can view the chart on full screen and select and zoom in on a section to get insights from details.

Visualize geographic data

Tell stories with maps

  • Structured geographic data can be projected into static/dynamic maps, clearly visualizing regional business.
  • Supports custom maps, such as shopping mall/workshop distribution, to allow visualized data analysis for local areas.

In-house developed 3D charts & easy-to-use JS APIs

Produce dynamic effects with "low-code"

  • With built-in dynamic effects for 3D charts, only some simple settings are needed to produce fantastic effects such as carousel and scrolling.
  • Diverse JavaScript APIs are encapsulated to meet special applications such as auto switch, refresh, and export.

Diverse plugins & ECharts API

You can realize whatever you want

  • A developer ecosystem is established, where 30+ chart plugins have been developed.
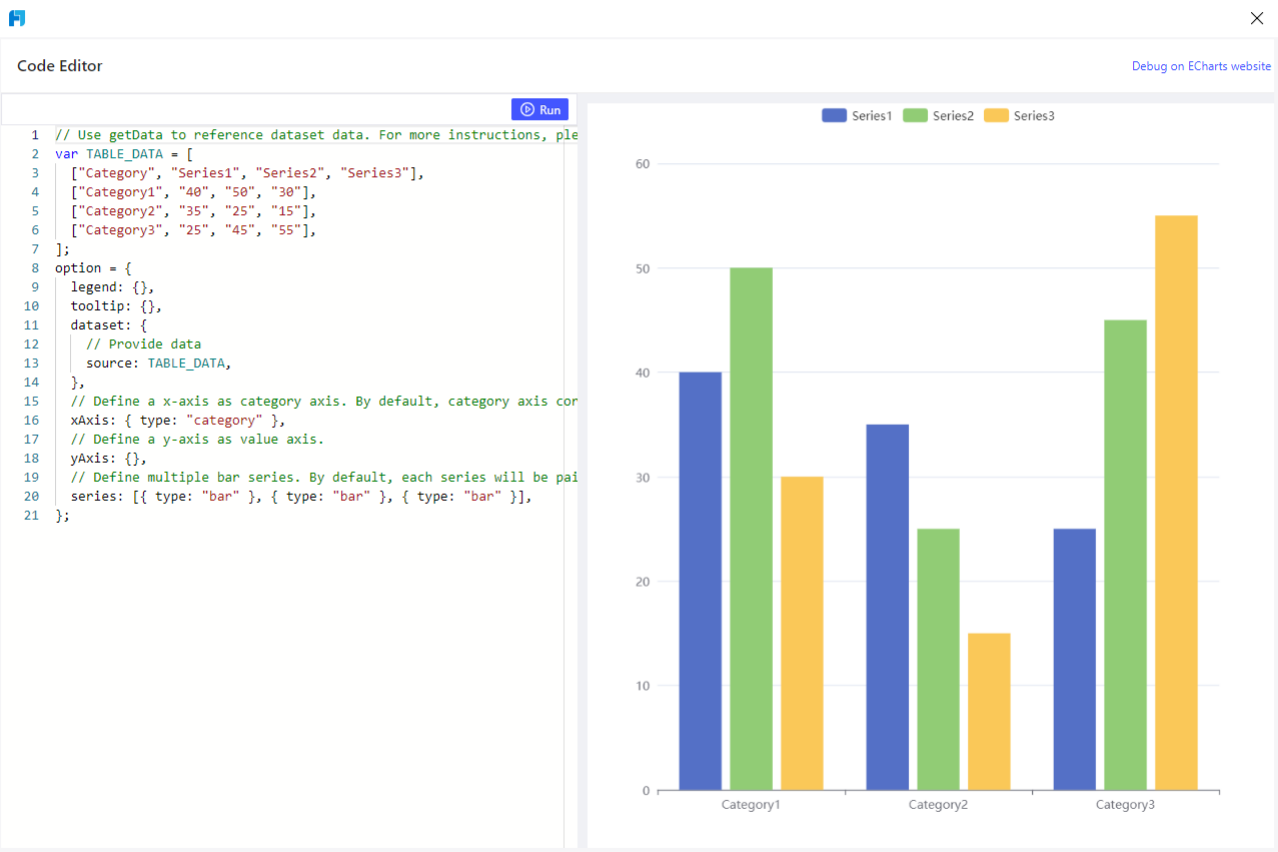
  • The ECharts API can be called visually to make it easier to customize charts.

Customer Testimony

A pharmaceutical company

FineReport allows for report presentation on multiple devices and provides simple and attractive charts and robust data entry capabilities. After nearly two years of using it, we are impressed the most by the fact that FineReport does not require maintenance personnel to have specialized programming skills, so it's effortless to get started. It also integrates multiple data sources, making it easier to realize powerful capabilities and unlimited requirements with simple JS code. In a nutshell, FineReport can do whatever you can; the stronger you are, the stronger FineReport is.

More Stories

Privacy     Copyright©2020 FanRuan Software Co., Ltd.

top